A farmer friend asked me a very thought-provoking question at the start of a late-summer meeting. He said, “You’ve been studying the corn market for over 40 years.
When do you think corn farming will be profitable again?”
He said he doesn’t like getting checks from the government to stay in business.
I spend a lot of time studying my daily charts and long-term charts, and price cycles. And I am still learning. I push myself to look at prices from many perspectives. For example, I monitor corn as a form of cash: I calculate how many bushels of cash corn in central Illinois it would take to buy a new combine. (The answer as I write this: about 180,000 bushels.) A new Ford pickup will cost you about 11,000 bushels of corn.
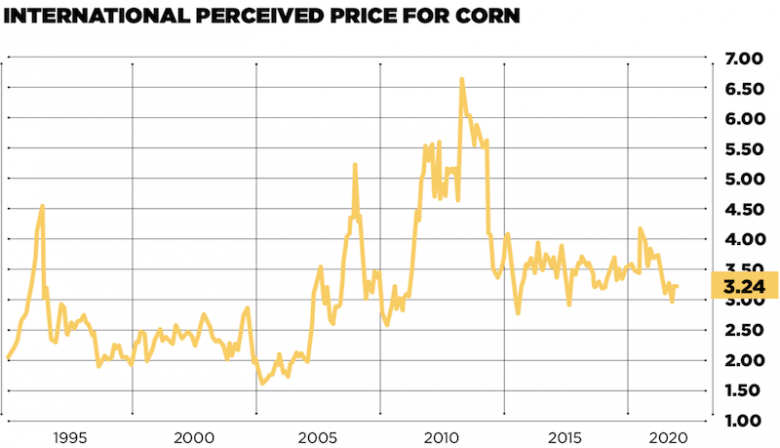
What I see is that if corn seems cheap to you right now, you are right. It really is cheap, and from almost every perspective I track. Even overseas (using currency exchange rates and the value of the U.S. dollar to calculate the actual cost of corn to foreign buyers), we are the best deal in town.
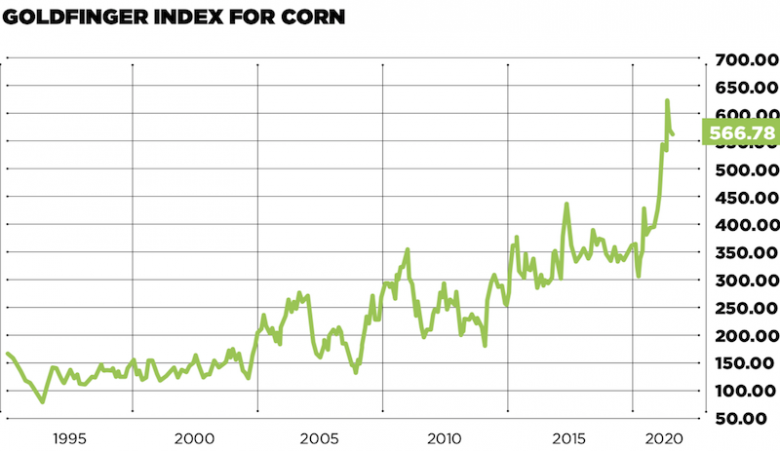
One of my favorite methods is what I call my Goldfinger Index. With this method, I track how many bushels of corn I can buy with an ounce of gold. This lets me view historic relationships and the purchasing power of a bushel of corn.
Let’s go back to 1971. That year, President Nixon used an executive order to abandon the last remnants of the U.S. gold standard. Before that, the price of gold was set at $35 an ounce and the dollar was backed by gold. However, since 1971, the U.S. and other nations throughout the world use fiat money (i.e., currency is created by central government banks). With the large deficits we are running here and around the world, we are creating a lot of money.
Enough of my economics lesson.
In the late 1960s and early 1970s, cash corn was about $1 per bushel. That meant an ounce of gold would buy 35 bushels of corn. By the late ’70s, as gold and corn prices went higher, the gold-to-corn price ratio went to about 100 bushels of corn per ounce of gold. In 1980, when gold first went to $800 an ounce, that ounce of gold would buy 250 bushels of corn. This was in 1980, when cash corn was $3.20 per bushel.
That $3.20 corn sure bought a lot more than it does in 2020. In fact, to match that purchasing power today (1980 corn at $3.20 corn per bushel), we would need to have corn at $10.74 per bushel in the fall of 2020.
How did this happen? When you look at 40 years of trends, prices, and purchasing power, it gets very complex. Here are my thoughts of how we got to this position.
#1. Farm size. The size of a farm required to make a liv- ing has gone up. Many of the full-time farmers I worked with in the 1980s were farming 320 to 600 acres. Those same families are now farming 2,000 to 3,000 acres to survive. Farmers have been forced to get larger to create more efficiencies and reduce their cost of production. They are businesses that farm for a profit. (You have to farm a lot of acres to have 180,000 bushels of corn to “spend” on a combine.)
#2. More production per acre. Corn yields averaged 90 to 100 bushels per acre from 1975 through 1980. This has jumped to an estimated 180 bushels per acre this year. Some states will have yield averages this year of over 200 bushels per acre. The same trend has developed in soybeans. The national average yield has increased from 28 to 30 bushels per acre in the late 1970s to over 50 bushels per acre this year.
Increased yields sound like a blessing, but it is a mixed blessing. The combination of larger farms and higher yields has created an exponential growth in the volume of corn and soybean production for many farms.
Farmers have not increased their farm size because they wanted to work harder or take on more risk. However, it was a necessary burden if they wanted to stay in business and stay profitable.
Back to the question asked by my old friend: When will it get better again?
Here is the good news: I think agricultural prices and profits will turn higher in the next two to five years. There is also some bad news: As inflation increases, you will need to really focus on managing your input expenses.
The collapse in demand because of the COVID-19 global pandemic was not in my forecast. What will signal that we have purchasing power, and prices using a lot of macro data or national information. For many farmers, these huge numbers are difficult to comprehend.
To take this down to your farm, look at different yield, price, and profit scenarios that can keep your farm in the black. You can make input decisions that will help you increase yields. It is never too late to learn more about marketing and how to make better decisions.
Plan on higher prices, higher input costs, and fewer government checks in 2021. Prepare for these changes by investing some of your time and brainpower in marketing skills and a marketing plan. You – and your family – will be glad you did.
What will be the sign that we finally turned the corner? Watch for these three signals:
1. The economy will improve. A very positive signal for the energy and corn market will be to see if nearby gasoline futures can close above $2.00 per gallon in 2021.
2. A monthly corn close above $3.94. I am watching for a close on the monthly corn chart above the 2020 high ($3.94) to signal a long-term change of trend for corn prices.
3. A monthly soybean close above $9.49. In 2020, a close above $9.49 on the monthly soybean chart will signal a long-term low and change of trend for soybean prices.
I have written about farm size, yields, purchasing power, and prices using a lot of macro data or national information. For many farmers, these huge numbers are difficult to comprehend. To take this down to your farm, look at different yield, price, and profit scenarios that can keep your farm in the black. You can make input decisions that will help you increase yields. It is never too late to learn more about marketing and how to make better decisions.
Plan on higher prices, higher input costs, and fewer government checks in 2021. Prepare for these changes by investing some of your time and brainpower in marketing skills and a marketing plan. You – and your family – will be glad you did.
----------
Note: The risk of loss in trading futures and/or options is substantial, and each investor and/or trader must consider whether this is a suitable investment. Past performance – whether actual or indicated by simulated historical tests of strategies – is not indicative of future results. Trading advice reflects good- faith judgment at a specific time and is subject to change without notice. There is no guarantee that the advice given will result in profitable trades. •
September 25, 2020 at 11:16PM
https://ift.tt/2G6oMxl
Corn is approaching all-time lows - Successful Farming
https://ift.tt/3gguREe
Corn


No comments:
Post a Comment